11 ways to use Microsoft 365 Copilot in Excel
23-09-2026
Boost your company's productivity with this AI tool.
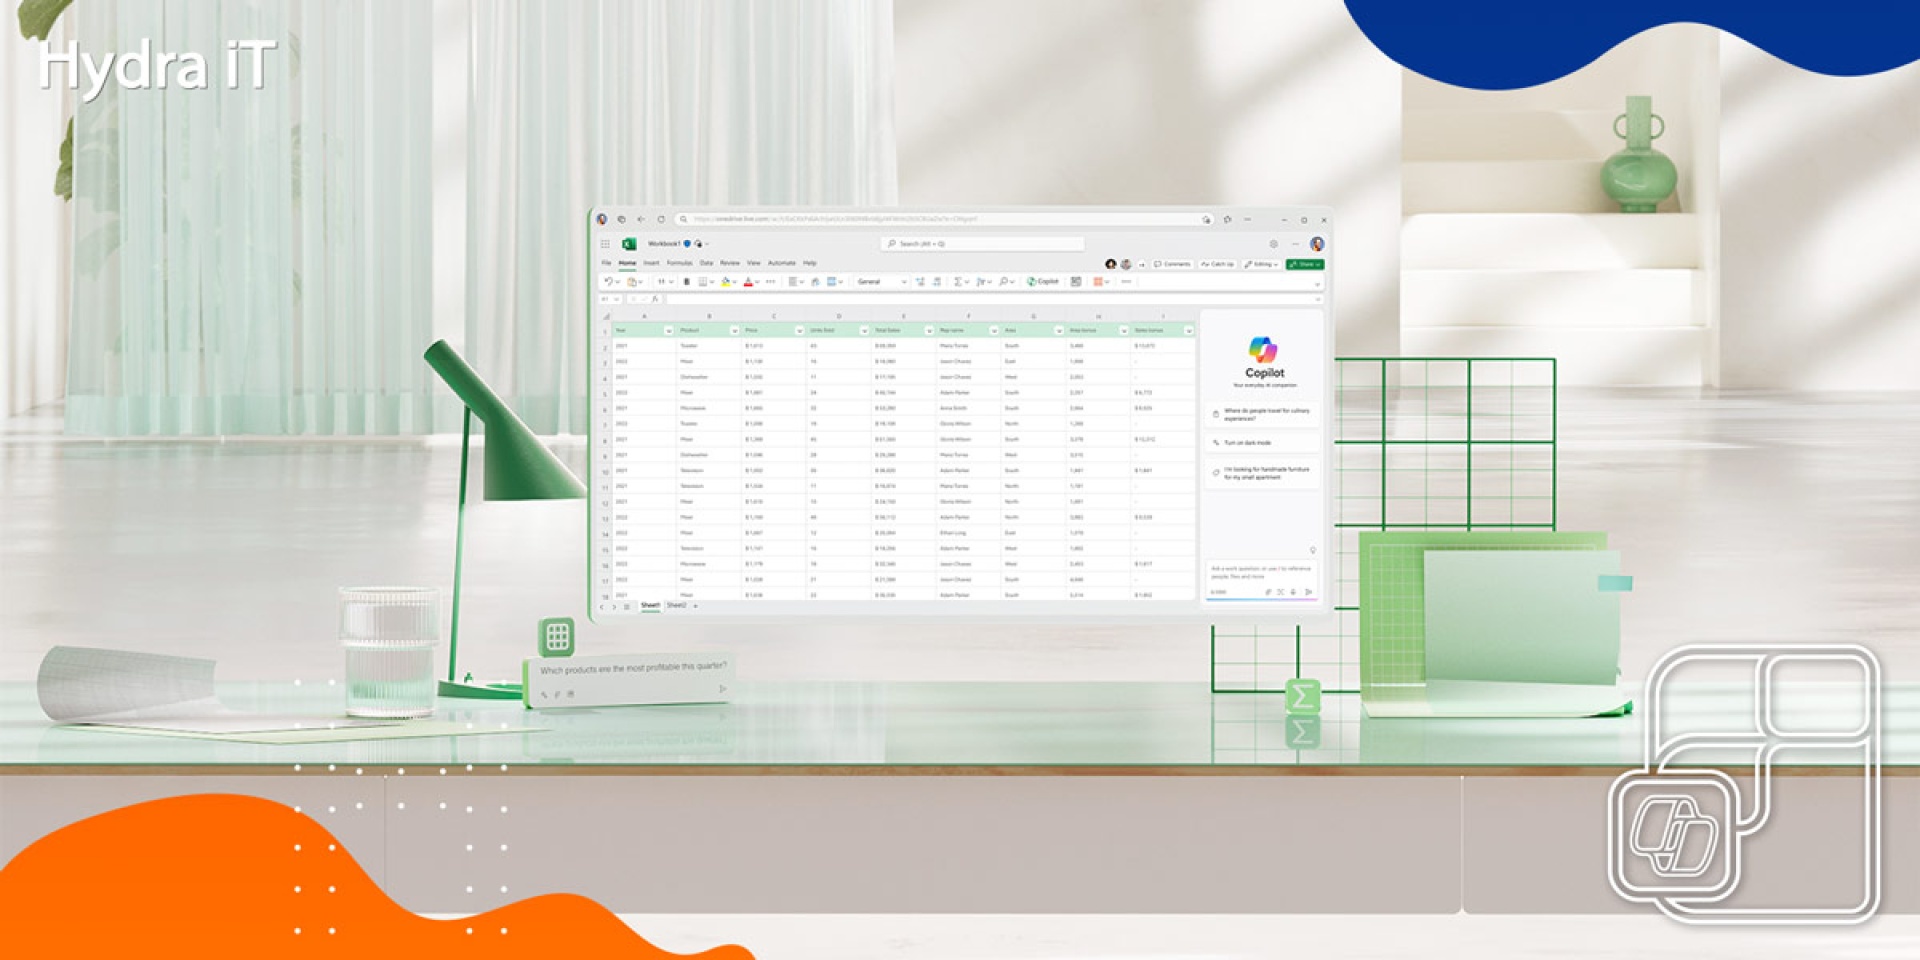
Excel remains one of the most widely used tools for data analysis and management. However, many tasks are still time-consuming, from creating complex formulas to preparing reports and analysing large volumes of information.
With Microsoft 365 Copilot, these tasks become simpler. Integrated directly into Excel, this artificial intelligence assistant helps users analyse data, automate processes, create visualisations and gain insights more quickly.
In this article, we show how Copilot can help transform the way you work in Excel and which features can have the greatest impact on your day-to-day work.
How to prepare Excel for Copilot
To get the most out of Copilot, there are a few important requirements:- Save the file in .xlsx format;
- Store the spreadsheet in OneDrive or SharePoint;
- Enable AutoSave (in the desktop version);
- Organise the data in table format.
Clean up the spreadsheet
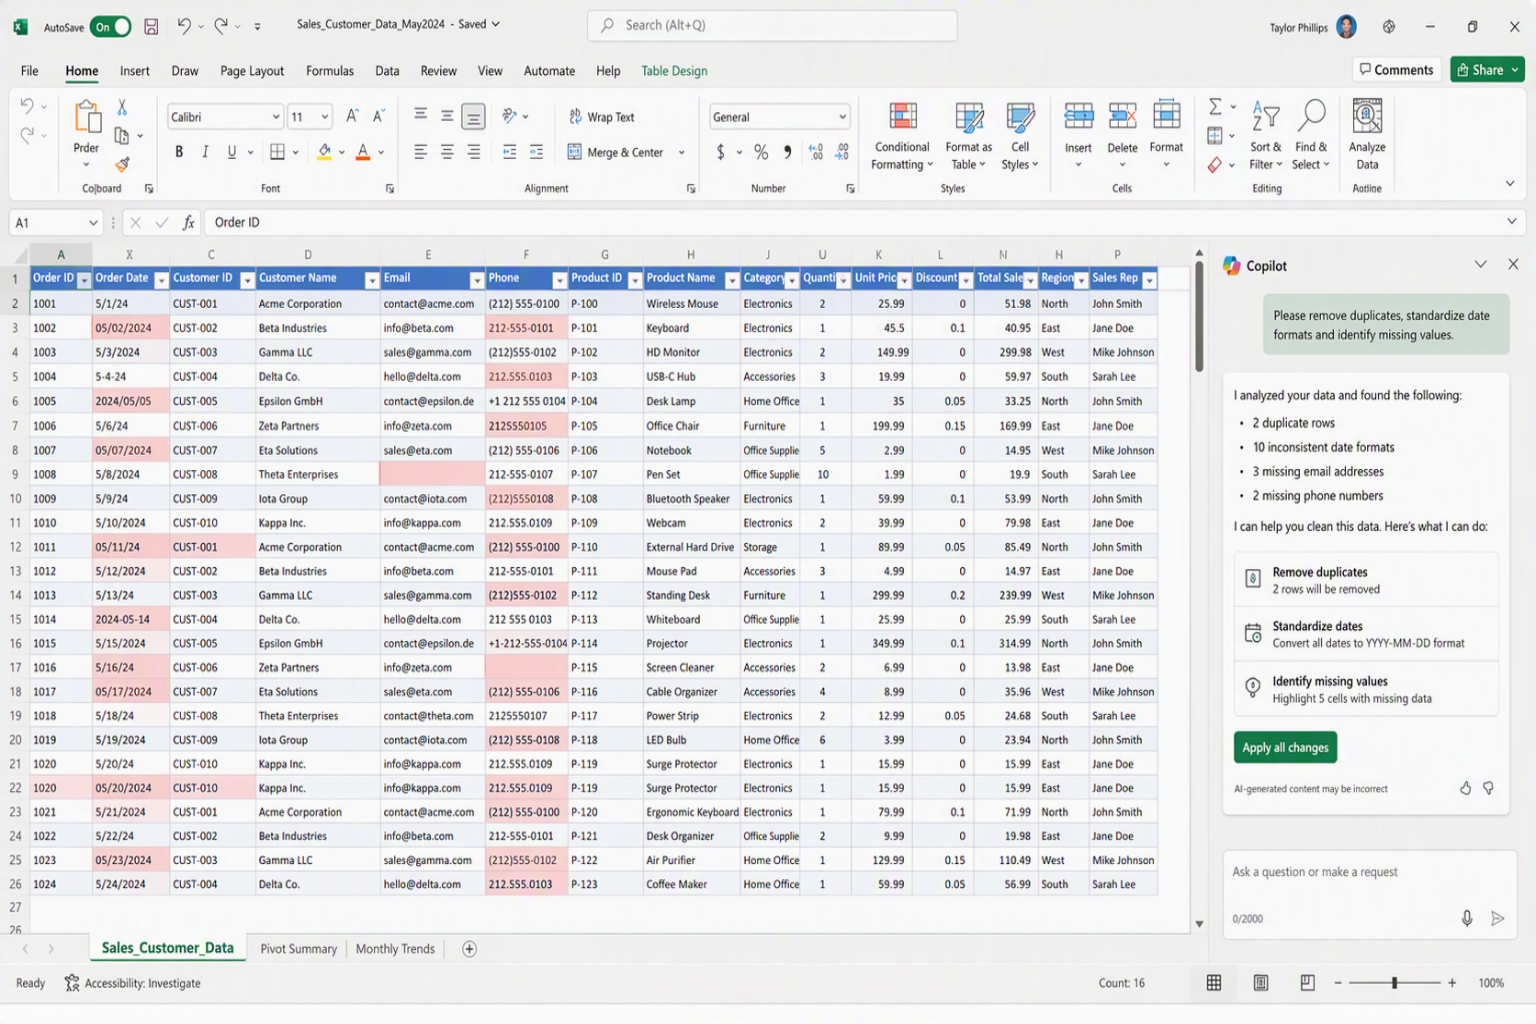
Importing data from other systems or working in shared files can introduce inconsistencies, duplicates or formatting errors.Copilot can help you:
- Remove duplicate rows and columns;
- Remove unnecessary spaces;
- Identify missing values;
- Standardise data formats.
Create columns and rows
Need to add new categories, calculations or classifications? Copilot can automatically generate new columns and rows based on your instructions.Examples of use:
- Create columns with automatic calculations;
- Generate date series;
- Organise data by category;
- Restructure existing information.
Create PivotTables
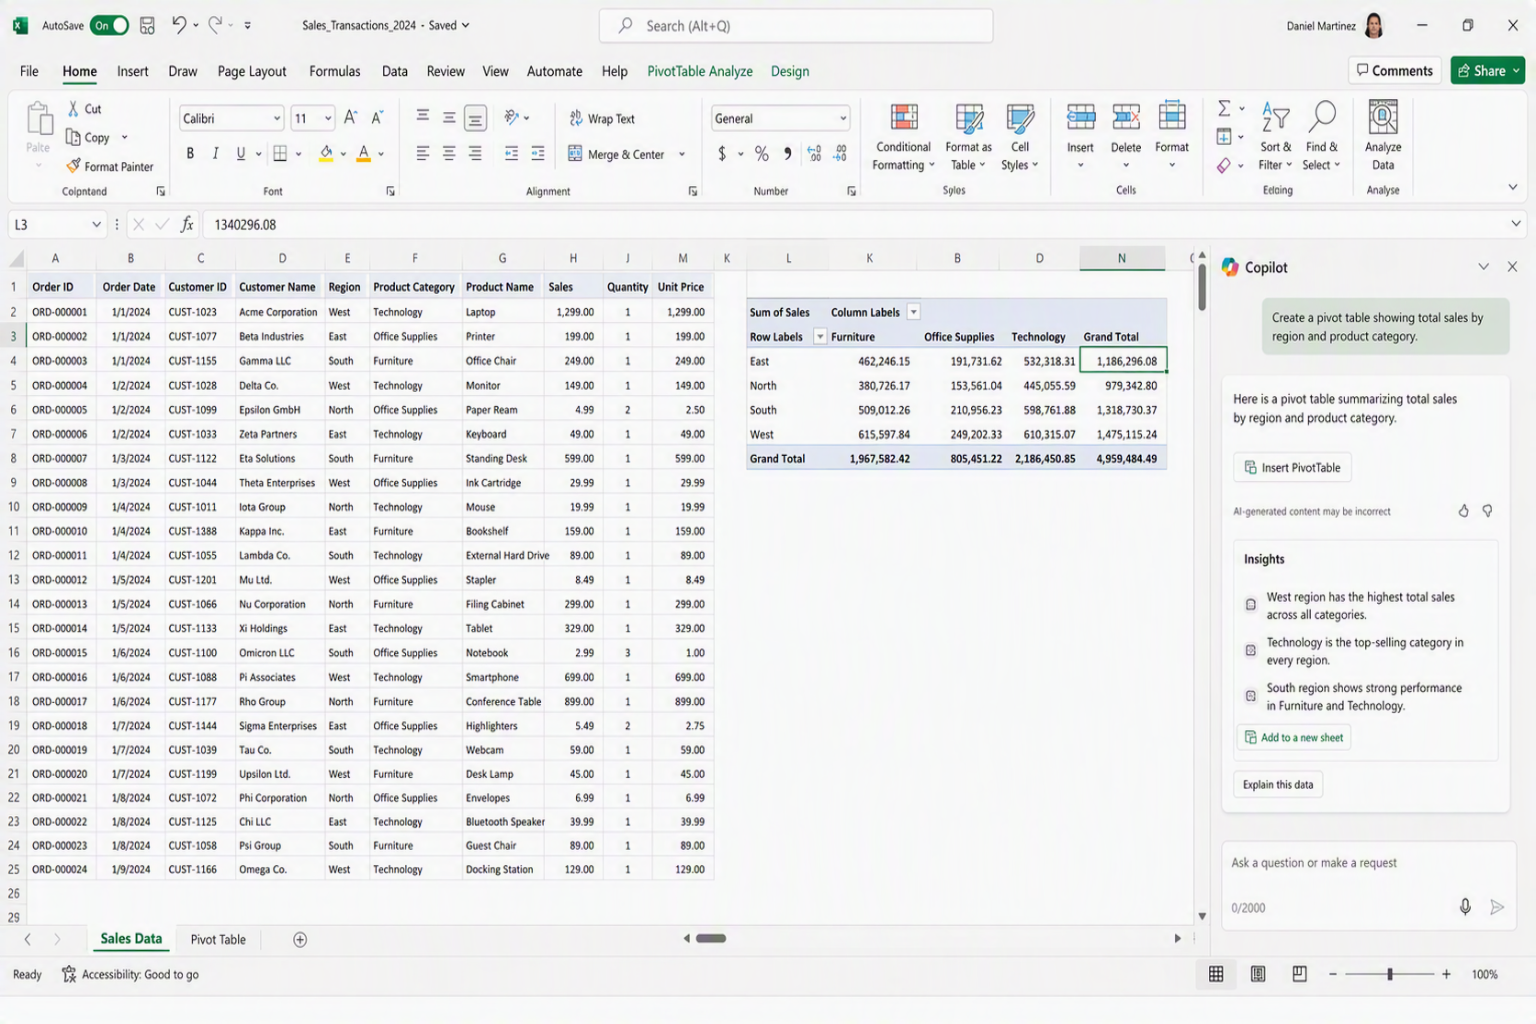
PivotTables are an essential tool for analysing large volumes of information. With Copilot, simply specify the data you want to analyse and the type of summary you need. In just a few seconds, you will have a PivotTable ready to use, with no need for manual configuration.
Apply conditional formatting automatically
Conditional formatting helps highlight trends, exceptions and relevant information.Copilot can automatically suggest or apply:
- Colour scales;
- Highlight values above or below specific thresholds;
- Identify critical values;
- Heat maps.
Create charts and diagrams
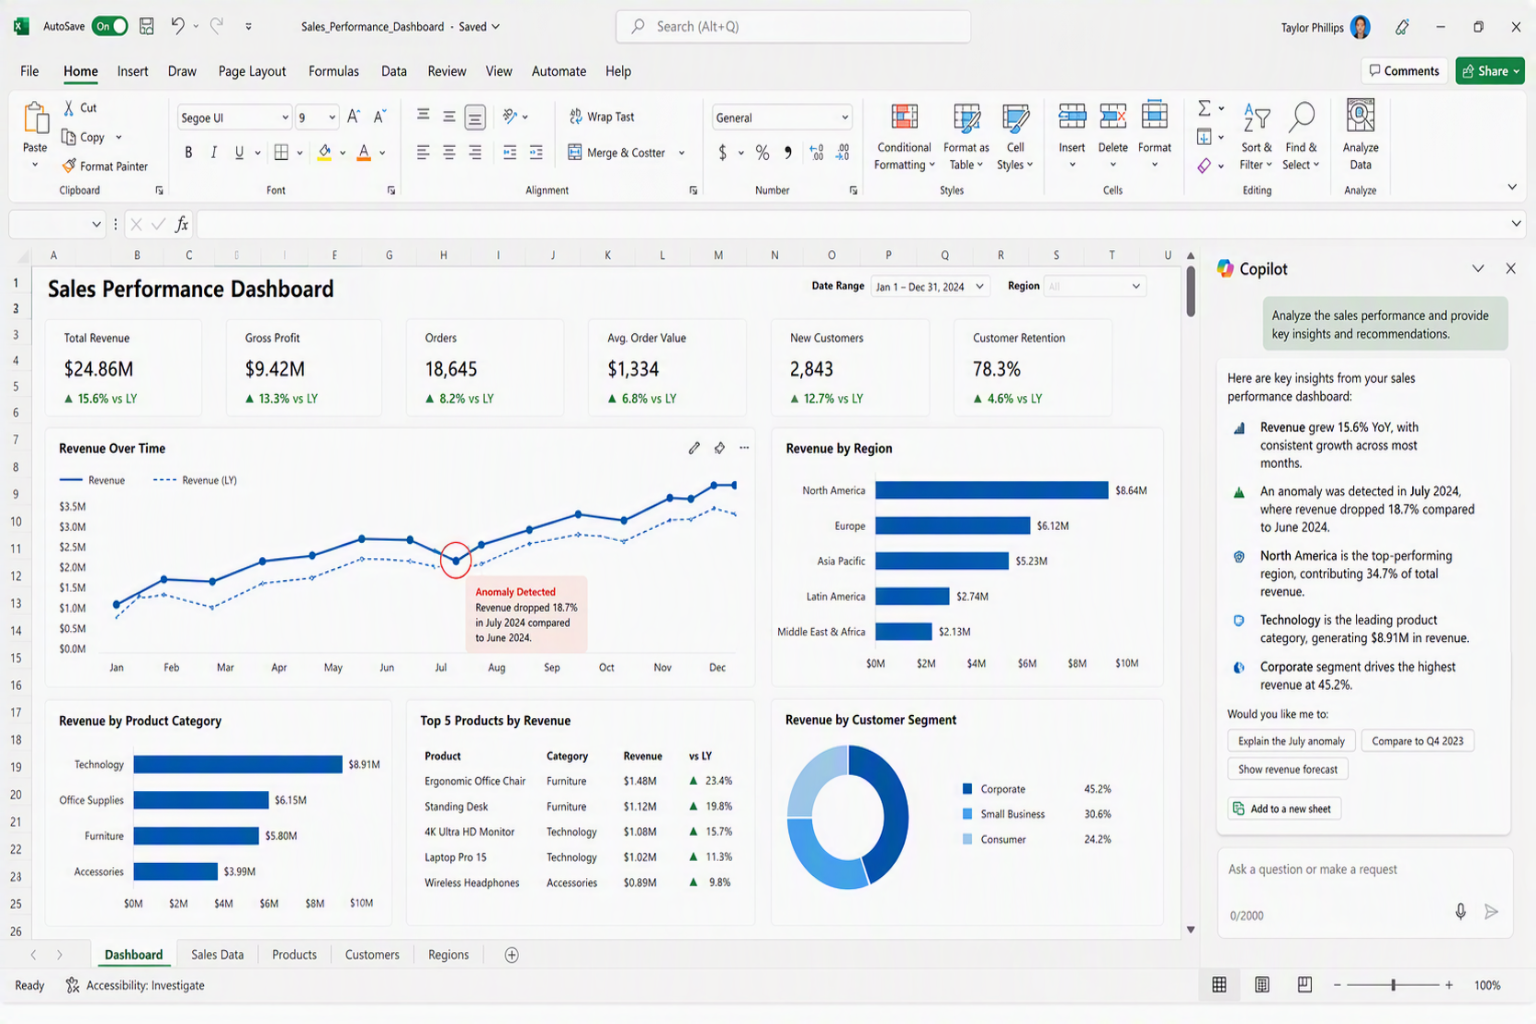
Turning numbers into visual information makes it easier to interpret data and communicate results.Copilot can automatically create:
- Bar charts;
- Pie charts;
- Line charts;
- Visual comparisons between datasets.
Explain existing formulas
If you do not understand a formula, Copilot can explain:- What it does;
- How it works;
- Which cells it uses;
- Why it may be returning errors.
Create formulas from a description
Can't remember the syntax of a function? Instead of searching online or consulting documentation, simply explain to Copilot what you want to calculate.Copilot automatically generates the appropriate formula for the scenario described.
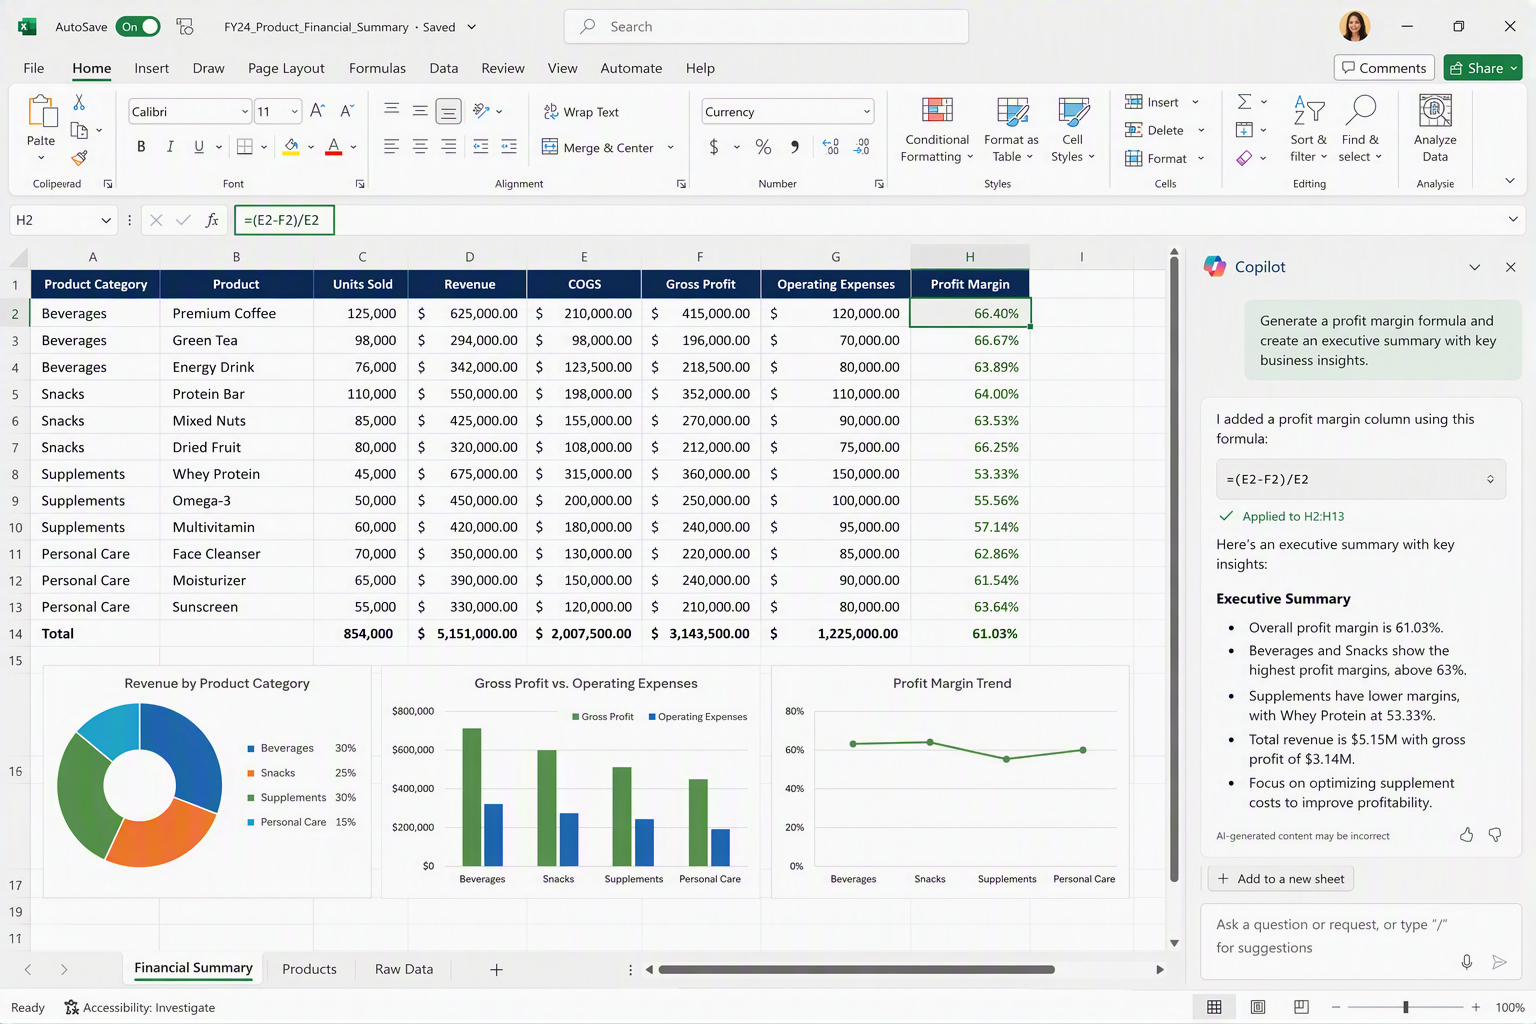
Summarise spreadsheets data
Copilot can analyse large volumes of information and turn them into clear, concise summaries.These summaries can take different forms:
- Executive reports;
- Financial summaries;
- Project overviews;
- Operational summaries.
Identify trends and anomalies
Data often contains patterns that are not immediately apparent.Copilot can help identify:
- Growth or decline trends;
- Unusual behaviour;
- Outliers;
- Potential data entry errors.
Simulate hypothetical scenarios
Copilot allows you to create alternative scenarios quickly, helping you anticipate impacts and support decision-making.This feature is particularly useful for:
- Financial planning;
- Budgeting;
- Sales forecasting;
- Risk analysis.
Use AI directly in a cell
Excel's new Copilot function lets you incorporate artificial intelligence capabilities directly into a cell.With this function, you can:
- Summarise data;
- Generate analyses;
- Gain quick insights;
- Create automatic descriptions.
Whether you want to automate day-to-day tasks, analyse large volumes of information or support strategic decisions, Copilot is redefining Excel's potential and making data analysis simpler, more intuitive and more accessible than ever.
Want to discover how Microsoft 365 Copilot can help your organisation work more intelligently? Talk to the Hydra iT team and explore the possibilities of AI applied to productivity and data analysis.
Share